

Using the 4200A-SCS Parameter Analyzer to Study the Electrical Properties of Photovoltaic Materials and Solar Cells
2025-06-23 16:34:02 1178
As the demand for clean energy grows, the potential of solar energy is increasingly gaining attention. Solar cells convert sunlight directly into electricity by absorbing photons and releasing electrons. Electrical testing is widely used in research and development and production to characterize their performance, including DC/pulse voltage measurements, AC voltage testing, etc., analyzing key parameters such as output current, conversion efficiency, and maximum power output, often under different light intensity and temperature conditions.
The 4200A-SCS Parameter Analyzer simplifies these electrical measurement processes by integrating DC and fast I-V, C-V measurement functions, along with control software, graphical plotting, and mathematical analysis capabilities. It is suitable for various measurements, including DC/pulse I-V, C-V, C-f, drive-level capacitance analysis (DLCP), four-probe resistivity, and Hall voltage measurements. This application note describes how to use the 4200A-SCS to perform these electrical measurements on photovoltaic cells. To simplify testing of photovoltaic materials and cells, the 4200A-SCS is equipped with corresponding test fixtures and a project that allows for easy execution of multiple common related measurements, including I-V, capacitance, and resistivity measurements, as well as formulas for extracting common parameters such as maximum power, short-circuit current, and defect density.
DC Current/Voltage (I-V) Measurement
Multiple parameters of solar cells can be obtained through current-voltage (I-V) measurements. This task can be accomplished using the 4200A-SCS's source measurement unit (SMU), which can function as both a voltage source and a current measurement device. The 4200A-SCS SMU has four-quadrant capability, enabling it to absorb cell current as a function of applied voltage. It is available in four models: 4200-SMU/4201-SMU (maximum 100 mA) and 4210-SMU/4211-SMU (maximum 1 A). If the battery current exceeds the above range, higher current support can be achieved by reducing the battery area or using Keithley SourceMeter® instruments.
Parameters obtained from I-V measurements
The equivalent circuit model of a solar cell includes a light-induced current source (IL), a diode, a series resistance (rs), and a shunt resistance (rsh). The series resistance affects the short-circuit current and output power, with an ideal value of 0Ω, while the shunt resistance reflects leakage current losses, with an ideal value of ∞. When light is incident on the solar cell and a load resistor is connected, the total current is I = ls(eqV/kT−1) − IL. Key parameters characterizing cell efficiency include the maximum power point (Pmax), energy conversion efficiency (η), and fill factor (FF). The maximum power point corresponds to the “inflection point” on the cell's I-V curve, where output power reaches its maximum.
Connecting to the solar cell for I-V measurement
Figure 1 shows the configuration for I-V measurement using the 4200A-SCS connected to a solar cell. The solar cell is tested using a four-wire connection, where one pair of leads (Force) provides the voltage, and the other pair (Sense) measures the voltage drop. This configuration eliminates the influence of lead resistance, ensuring measurement accuracy, while the Sense-end leads compensate for voltage deviations, ensuring the cell voltage aligns with the set value.
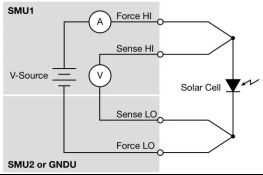
Figure. 1 4200A-SCS connected to a solar cell for I-V measurement
Forward-biased I-V measurement
Forward-biased I-V measurements of the solar cell are performed under controlled illumination using the “fwd-ivsweep” test conducted by the SMU of the 4200A-SCS, with the voltage swept from 0 to the open-circuit voltage (Voc). Short-circuit current (Isc) and open-circuit voltage (Voc) can be directly extracted from the scan data, while other parameters such as conversion efficiency (η) and current density (J) can be calculated using a formula engine. I-V scan results can be plotted as semi-logarithmic or inverted graphs to support different analysis requirements.
The series resistance (rs) can be determined from the forward I-V curve at different light intensities by connecting points in the linear region and measuring the inverse of their slope. The SMU of the 4200A-SCS has extremely low voltage load, only a few hundred μV, making it more suitable for low-voltage measurements of solar cells compared to traditional digital multimeters, thereby reducing test errors.
Reverse-biased I-V measurement
From reverse-biased I-V data, the solar cell's leakage current and shunt resistance (rsh) can be derived. Testing is typically conducted in a darkroom by gradually increasing the voltage to the breakdown level and measuring the current to plot the curve. The SMU's preamplifier supports precise measurements at the pA level or even smaller. Using low-noise cables and a shielded box can further reduce interference, with the shield connected to the Force LO terminal of the 4200A-SCS.
The shunt resistance (rsh) can be calculated from the slope of the linear region of the reverse-biased I-V curve (as shown in Figure 2). The Solar Cell Reverse I-V Sweep (“rev-ivsweep”) test generates the actual reverse bias characteristic curve, with a semi-logarithmic plot showing the relationship between current absolute value and reverse bias voltage (as shown in Figure 3), enabling more intuitive analysis.

Figure. 2 Typical reverse bias characteristic of a solar cell
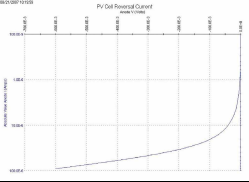
Figure. 3 Reverse bias I-V measurement of a silicon solar cell using an SMU
Capacitance Measurement
C-V measurements are highly useful for deriving specific parameters of solar devices. Depending on the type of solar cell, capacitance-voltage (C-V) measurements can be used to derive parameters such as doping concentration and built-in voltage of the junction. Capacitance-frequency (C-f) scans can be used to determine whether traps (hole/well capacitance) exist in the depletion region. The optional 4210-CVU or 4215-CVU for the 4200A-SCS serves as a capacitance meter, measuring capacitance-related functions: applied DC voltage (C-V), frequency (C-f), time (C-t), or applied AC voltage. The CVU can also measure conductance and impedance.
To perform capacitance measurements, as shown in Figure 4, connect the solar cell to the CVU. Similar to I-V measurements using an SMU, capacitance measurements also involve a four-wire connection to compensate for lead resistance. The HPOT/HCUR terminals are connected to the anode, and the LPOT/LCUR terminals are connected to the cathode. Connect the DC high-voltage source terminals of the CVU to the anode.
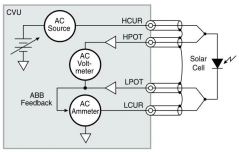
Figure. 4 Connecting the solar cell to the CVU capacitance meter
Figure 4 shows the shielded connections of the four coaxial cables from the capacitance meter's four terminals. The shields from the coaxial cables must be connected as close as possible to the solar cell to achieve the highest accuracy, as this reduces the influence of inductance in the measurement circuit. This is particularly important for capacitance measurements at higher test frequencies.
Since the capacitance of the cell is directly related to the area of the device, it may be necessary to reduce the area of the cell itself, if feasible, to avoid capacitance that is too high to measure. Additionally, setting the CVU to measure capacitance at lower test frequencies and/or lower AC drive voltages will allow for the measurement of higher capacitance values.
C-V Scan
C-V measurements can be performed under forward or reverse bias conditions. However, under forward bias, the DC voltage must be limited to avoid measurement failure due to excessively high conductivity, and the DC current must not exceed 10 mA, otherwise the instrument may enter a clamping state. Under reverse bias conditions, the C-V curve generated by the Solar Cell C-V Sweep test is shown in Figure 5.
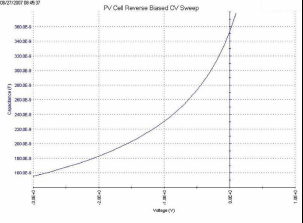
Figure. 5 C-V Scan of a Silicon Solar Cell
For further analysis, a plot of 1/C² versus voltage can be generated (as shown in Figure 6). The built-in voltage can be derived from the intersection of the 1/C² curve with the horizontal axis, while the doping density is displayed as a function of voltage in the Analyze window. Users can input the cell area using the formula editor to calculate these parameters or directly obtain the built-in voltage value via the linear fitting option.
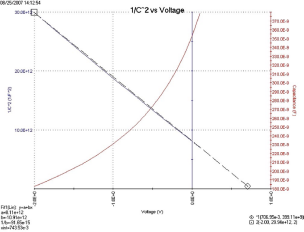
Figure. 6 1/C² vs. Voltage for Silicon Solar Cells
C-f Scan
The CVU option can also measure capacitance, conductance, or impedance as a function of test frequency. The frequency range spans from 1 kHz to 10 MHz. The curves in Figure 7 were generated using the Solar Cell C-f sweep or “cfsweep” test. Both the scan frequency range and bias voltage can be adjusted. Required parameters, such as trap density, can be extracted from the capacitance versus frequency data. Measurements can be repeated at different temperatures.
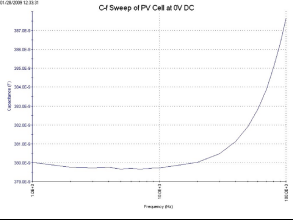
Figure. 7 C-f scan of a solar cell
Drive-Level Capacitance Analysis (DLCP)
Drive-Level Capacitance Analysis (DLCP) is a technique used to determine trap density (NDL) as a function of photovoltaic cell junction depth. In DLCP measurements, the peak-to-peak value of the AC voltage is swept while the DC voltage varies with capacitance measurements. Unlike traditional C-V measurements, DLCP maintains the total applied voltage (AC + DC) constant and changes the fixed position (Xe) within the sample by adjusting the DC voltage bias to determine the exposed charge density (ρe).
The key advantage of DLCP is its ability to analyze the characteristics of trap density as a function of distance by adjusting the DC bias, as well as perform energy analysis at specific depths. Additionally, the measurement allows for changes in test frequency and temperature to enable more detailed energy-based analysis.
Pulse I-V Measurement
Pulse I-V measurement is used to analyze solar cell parameters such as conversion efficiency, minimum carrier lifetime, and battery capacitance effects. Measurements are performed using the 4225-PMU module, which outputs pulse voltage, captures high-speed waveforms, and absorbs current. It supports single-channel or dual-channel configurations and uses 2-wire technology to correct cable voltage losses, eliminating the need for 4-wire measurements.
To ensure measurement accuracy, it is necessary to verify that the pulse width is sufficiently long. The waveform capture mode can be used for dynamic testing and pulse setting optimization. For solar cells with larger capacitance, the stabilization time can be reduced by decreasing the cell area. The results shown in Figure 8 indicate that the PMU absorbs current, with the current curve extending into the fourth quadrant.
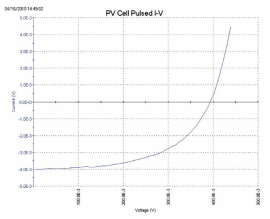
Figure. 8 Pulse I-V measurement of a solar cell using the 4225-PMU
Resistivity and Hall voltage measurements
The magnitude of resistivity directly affects the performance of solar cells, so measuring the resistivity of cell materials is a common electrical test. The resistivity of semiconductor materials is typically measured using the four-probe method, which effectively eliminates errors caused by probe resistance, extended resistance, and contact resistance between metal contacts and the material.
Common resistivity measurement techniques include the four-probe method and the van der Burg method. The SolarCell project includes multiple tests for performing both of these measurements, as well as independent tests for measuring the van der Burg coefficient and Hall coefficient. Users can enter the corresponding test name (e.g., vdp-surface-resistivity, vdp-volume-resistivity, or hall-coefficient) in the search bar of the Select view to quickly locate the desired test.
Four-probe measurement method
The four-probe technique involves placing four equally spaced probes in contact with a material of unknown resistance. As shown in Figure 9, the probe array is positioned at the center of the material. Two outer probes are used to apply the current source, while two inner probes measure the voltage difference generated across the material's surface.
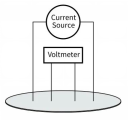
Figure. 9 Four-probe resistivity measurement
Calculating surface or film resistivity using known applied current and measured voltage:
If the sample thickness is known, the bulk resistivity can be calculated as follows:
Resistivity Measurement Using the Vanderbilt Method
The Vanderbilt (vdp) technique measures resistivity using four isolated contacts on a flat, arbitrarily shaped sample. The resistivity is determined based on eight measurements taken around the sample, as shown in Figure 10.
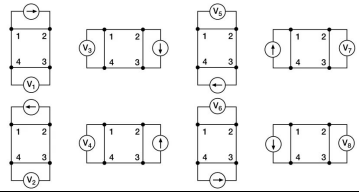
Figure. 10 Van de Parre resistivity measurement method
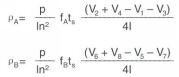
Once all voltage measurements are completed, two resistivity values ρA and ρB can be derived:
Testing using the VDP-Resistivity Subsite and VDP Method
To automate VDP resistivity measurements, the solarcell project has a VDP-resistivity subsite containing four tests: “i1-v23,” “i2-v34,” “i3-v41,” and “i4-v12.” Screenshots of the tests are shown in Figure 11.

Figure. 11 Screenshot of VDP test
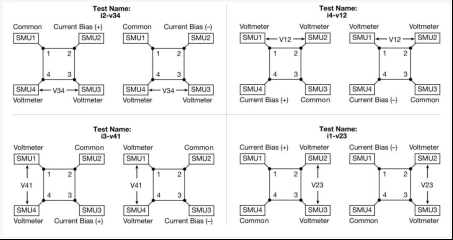
Figure. 12 SMU configuration for Vanderbilt measurements
Each terminal of the sample is connected to the Force HI terminal of the SMU, so a 4200A-SCS with four SMUs is required. The configuration of the four SMUs varies in each test: one SMU provides the test current, two are configured as voltmeters, and one is set as the common terminal. This measurement setup is repeated around the sample, with each of the four SMUs performing different functions in each of the four tests. Figure 12 shows the function of each SMU in each test.
Hall Voltage Measurement
Hall effect measurements are important for characterizing semiconductor materials, as the Hall voltage can be used to derive the conductivity type, carrier density, and Hall mobility. Under an applied magnetic field, the Hall voltage can be measured using the configuration shown in Figure 13.
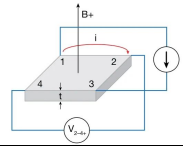
Figure. 13 Hall voltage measurement
The SolarCell project does not include specific tests for measuring Hall voltage; however, four tests can be added to the subsite to determine the Hall coefficient and mobility. Since the configuration for Hall measurements is very similar to that for van der Pol resistivity measurements, the vdp test can be copied and modified for Hall voltage measurements. These modifications involve changing the functions of the SMUs. If a permanent magnet is used, an action from the action library can be used to create a dialog box prompt that stops the test sequence in the project tree and instructs the user to change the magnetic field applied to the sample. A project prompt is a dialog box window that pauses the project test sequence and prompts the user to perform certain actions. For instructions on how to use dialog box actions, refer to the 4200A-SCS Reference Manual. Finally, derive the Hall coefficient and mobility in the Calc table of the subsite. These mathematical functions can be added to other formulas for determining resistivity.
Conclusion
Measuring the electrical characteristics of solar cells is critical for determining the device's output performance and efficiency. The 4200A-SCS simplifies cell testing by automating I-V, C-V, pulse I-V, and resistivity measurements, and provides graphical and analytical capabilities. For current measurements exceeding 1A, Keithley offers source-meter instruments suitable for solar cell testing. Instead of using four separate tests to measure Hall voltage in the subsite's Cal table, add the Hall coefficient test from the library, which combines all measurements and parameter extraction into a single test.


